Performance
Out of 545 investments by Tech Coast Angels through 2023, 263 (48%) are still active.
Of those no longer active:
- 126 (45%) returned some cash to investors
- 156 (57%) were total write-downs or seem inactive
Of the 126 Exits
- 86 returned at least 100% of the investor’s capital
- 33 returned between 5x and 368x
- 8 have no info on the multiple returned
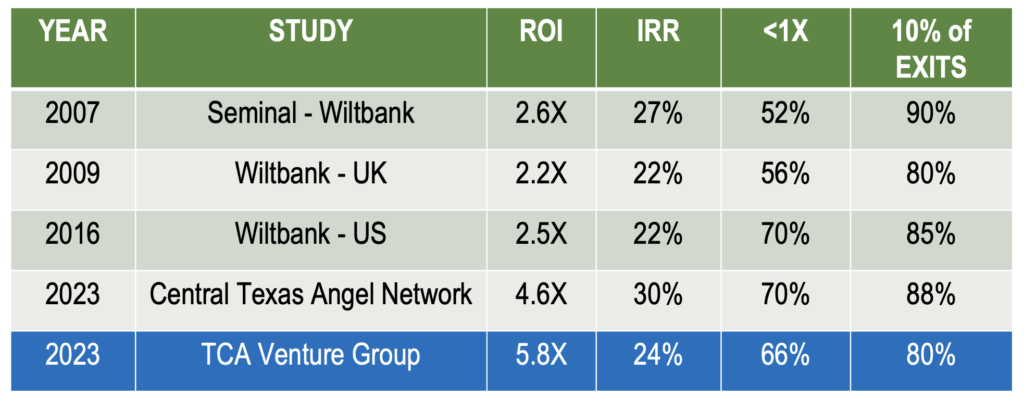
At the highest price achieved after IPOs, TCA’s return (assuming equal weighting) has been 5.8x and the IRR has been 23.6%. Tax benefits from the write-offs are not included in TCA returns.
This analysis of 282 Tech Coast Angels outcomes from 1997-2023 compares favorably to other benchmarks including 132 Central Texas Angel Network outcomes from 2006-2023 and three previous large studies by Professor Rob Wiltbank which also showed IRR’s in a similar range: 27% (2007 study), 22% (2009 Study) and 22% (2016 Study).

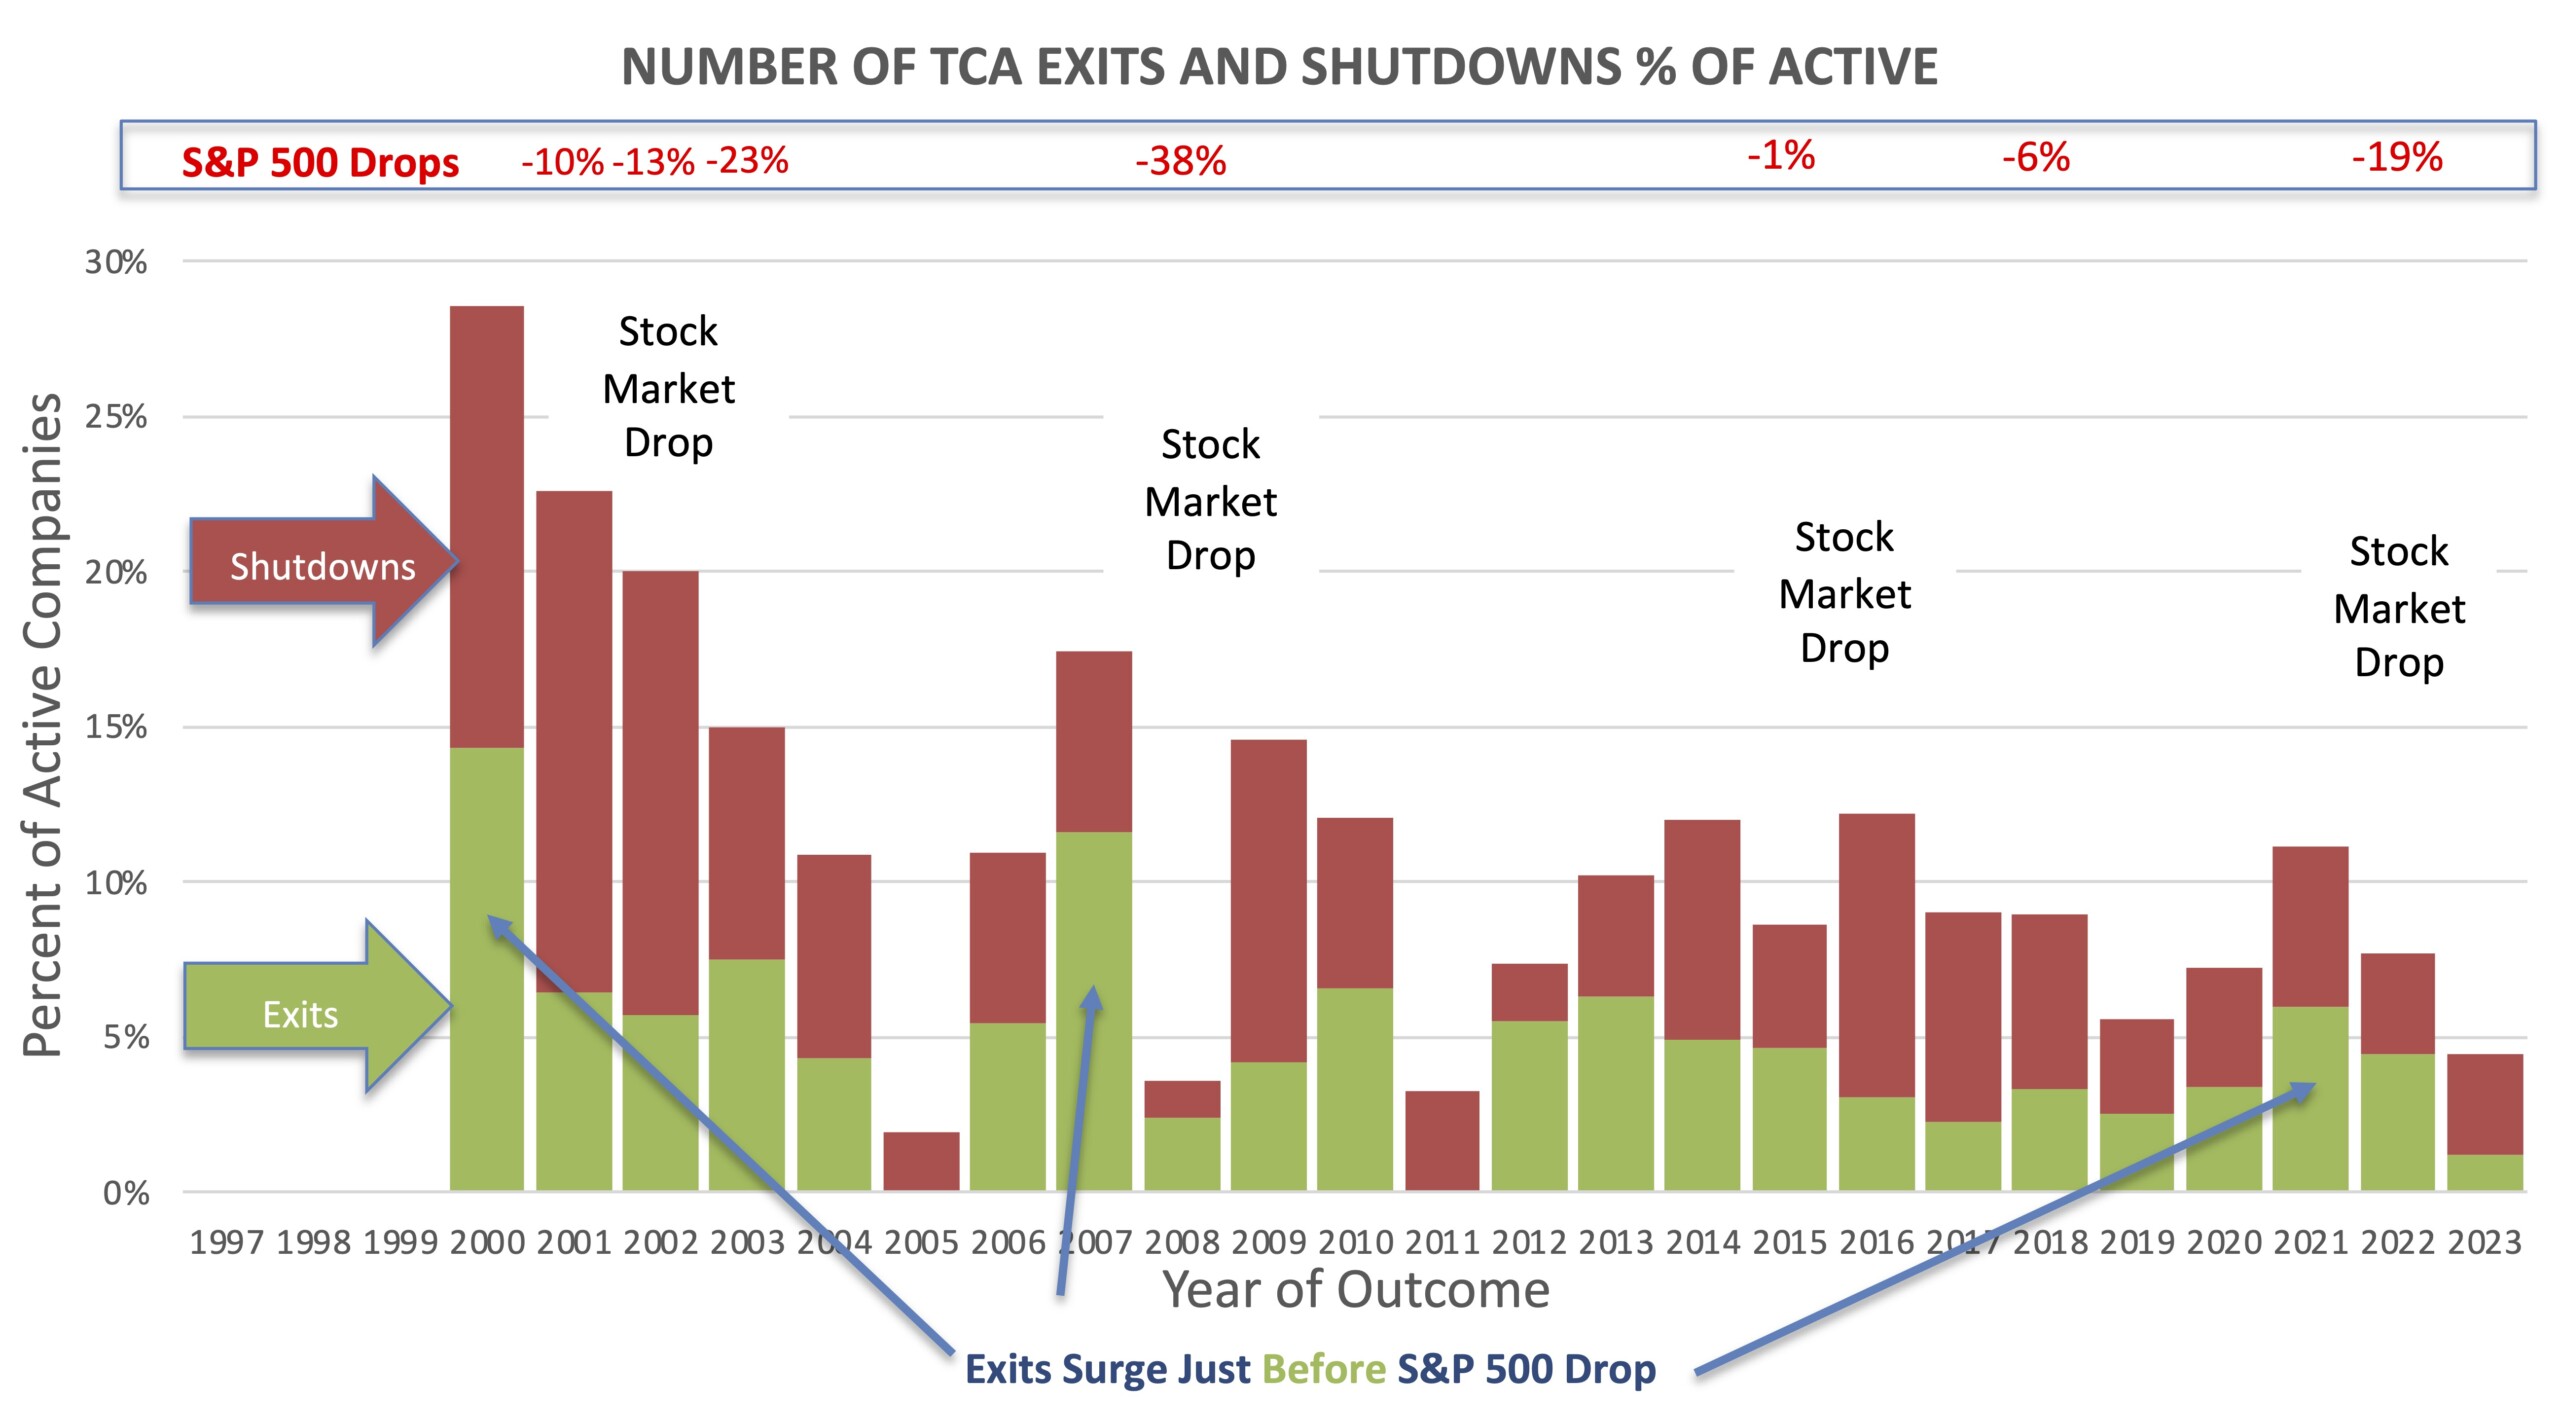
Exits & Shutdowns by Year

Outcomes by Years Since Investment

Exit Distribution by Years Since Investment

Cumulative TCA Return over Time

